Gun Deaths vs. Gun Ownership
In the wake of the tragic shooting at Sandy Hook Elementary School there was a flurry of discussion about gun control in my Twitter and Facebook feeds. One statistic from an April 2012 New Yorker article caught my attention:
The United States is the country with the highest rate of civilian gun ownership in the world. (The second highest is Yemen, where the rate is nevertheless only half that of the U.S.) No civilian population is more powerfully armed.
I posted this quote on Facebook and was asked whether there was any correlation between rates of gun ownership and gun-related deaths. After 20 minutes of grabbing some data on worldwide gun ownership and gun deaths from Wikipedia and running it through R I produced the following graph.
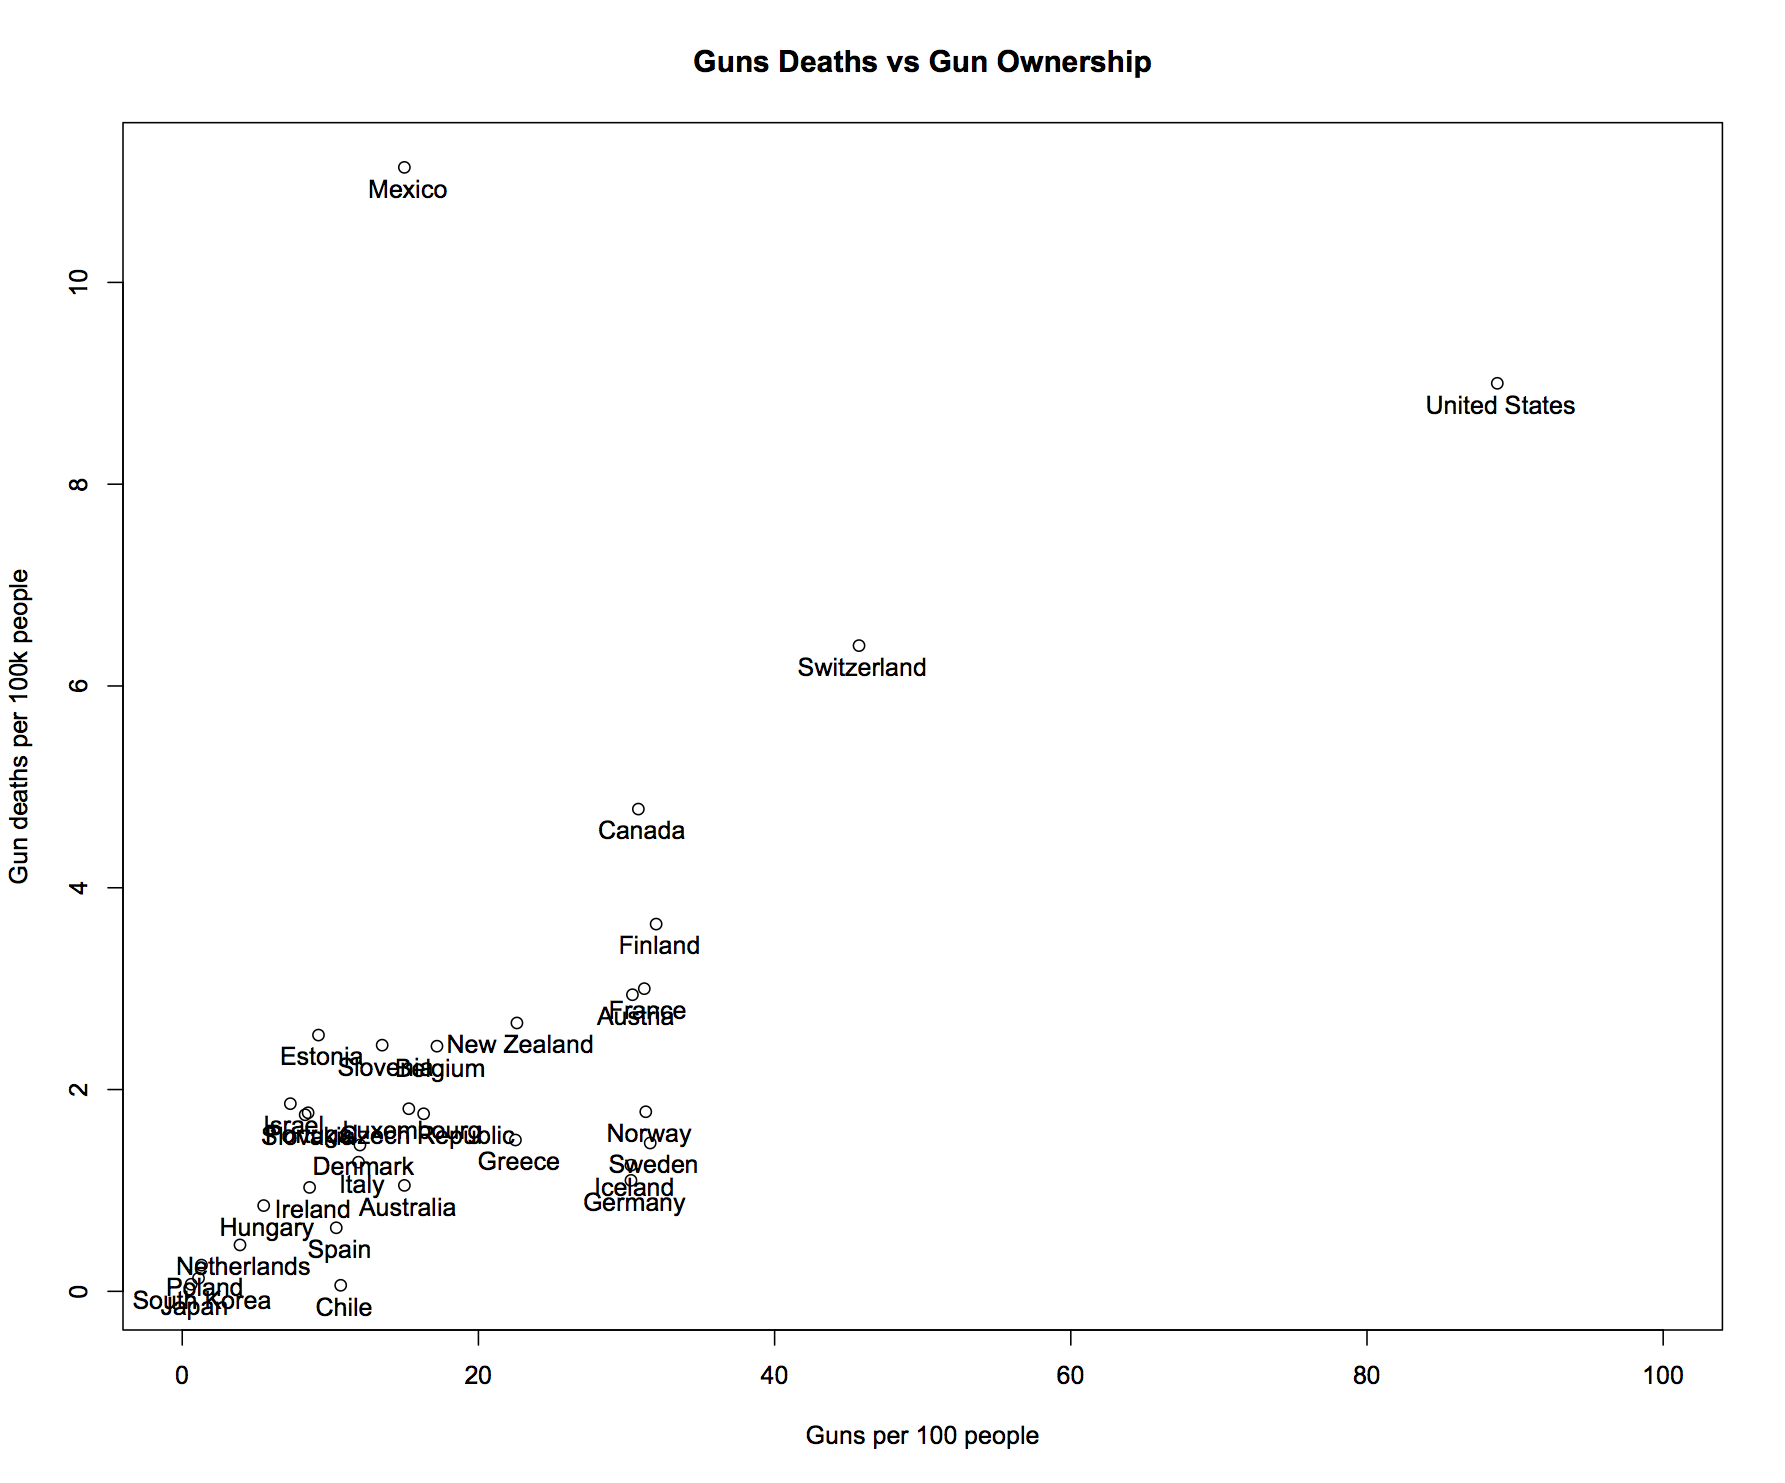
Figure 1: Gun-related deaths per capita vs. gun ownership per capita in OECD countries.
I posted this graph on Twitter late on Sunday night and woke up this morning to find it had been retweeted over 200 times. In addition, there were a large number of questions and requests for different graphs.
Out of curiosity, I grabbed gun death and gun ownership data for OECD countries from Wikipedia and ran it through R: dl.dropbox.com/u/38668/deaths…
— Mark Reid (@mdreid) December 16, 2012
So that others can analyse the data I used themselves, I thought I would write up how I created the graph.
The Data
The first step was finding data on gun ownership and gun-related deaths and getting it into R.
A quick search revealed Wikipedia articles on countries by firearm-related death rate and Number of guns per capita by country. I cut and pasted the tables in these articles into a text editor and saved them as CSV files. I also grabbed a list of OECD countries from Wikipedia and converted it. You can grab the resulting files here:
- deaths.csv (as of 17 Dec. 2012)
- guns.csv (as of 17 Dec. 2012)
- oecd.csv (as of 17 Dec. 2012)
The Code
The R code I used to create the plot is given below. It simply reads in the data from the guns and deaths CSV files, merges them, adds a column denoting whether a country is in the OECD, and then plots the results.
guns <- read.table("data/guns.csv", sep="\t", header=TRUE)
deaths <- read.table("data/deaths.csv", sep="\t", header=TRUE)
oecd <- read.table("data/oecd.csv", sep="\t", header=TRUE)

data <- merge(guns, deaths, by="Country")
data$OECD <- data$Country %in% oecd$Country

with(subset(data, data$OECD == TRUE), {
	plot(Deaths ~ Guns,
		main="Gun Deaths vs Gun Ownership",
		xlab="Guns per 100 people",
		ylab="Gun deaths per 100k people",
		xlim=c(0,100)
	);
	text(Guns, Deaths, Country, pos=1)
})
You can get all the code I used to generate the figures in this post here:
Other Graphs
I was asked a number of good questions about the graph I posted on Twitter. In particular, several people were surprised at the number of gun-related deaths for Switzerland. As the following graph of gun homicides vs. gun ownership shows, most of those deaths are actually suicides.
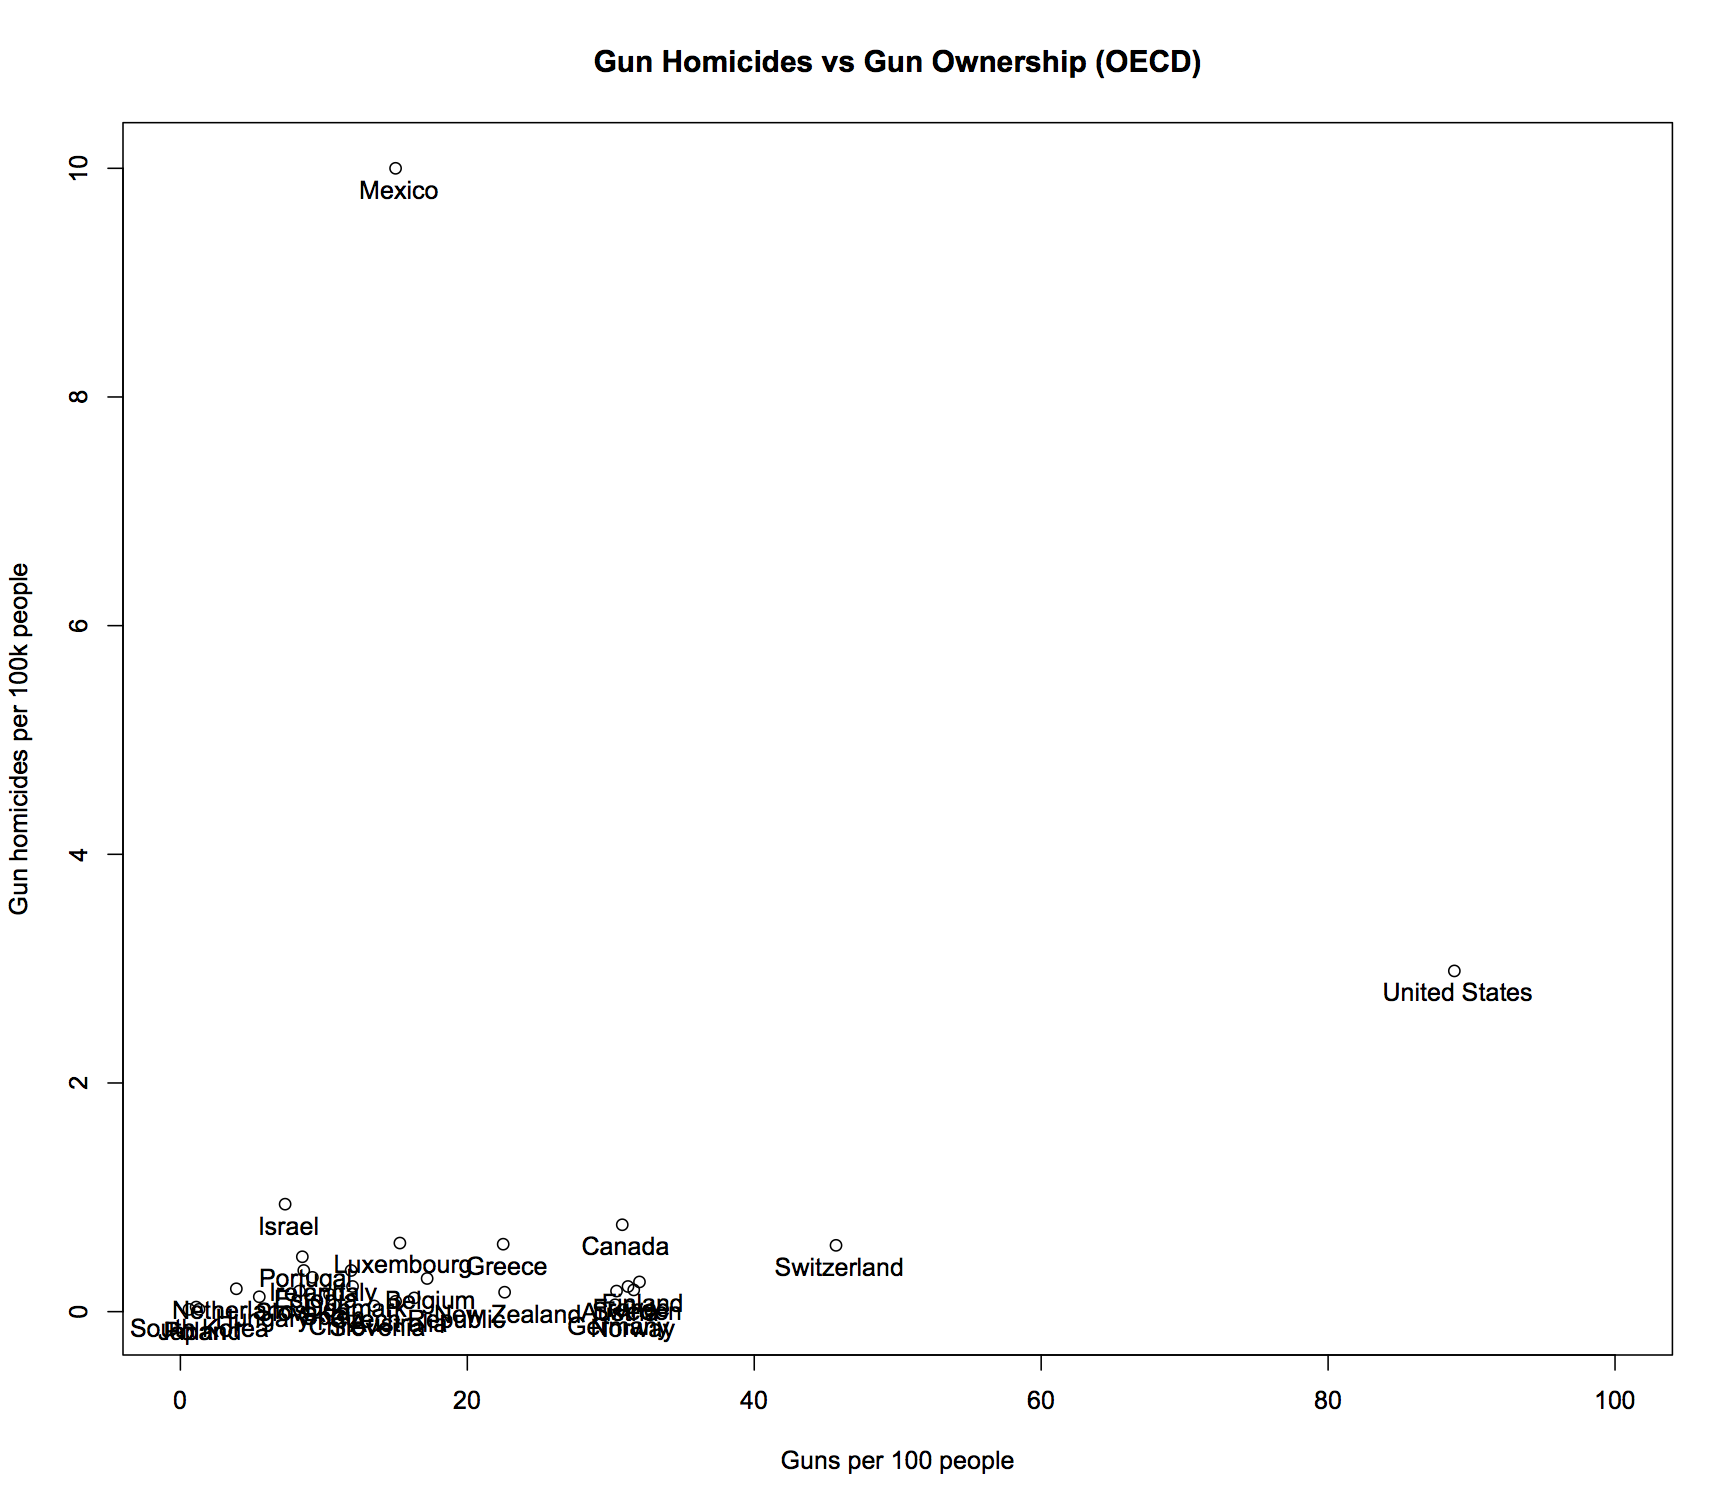
Figure 2: Gun homicides per capita vs. gun ownership per capita in OECD countries.
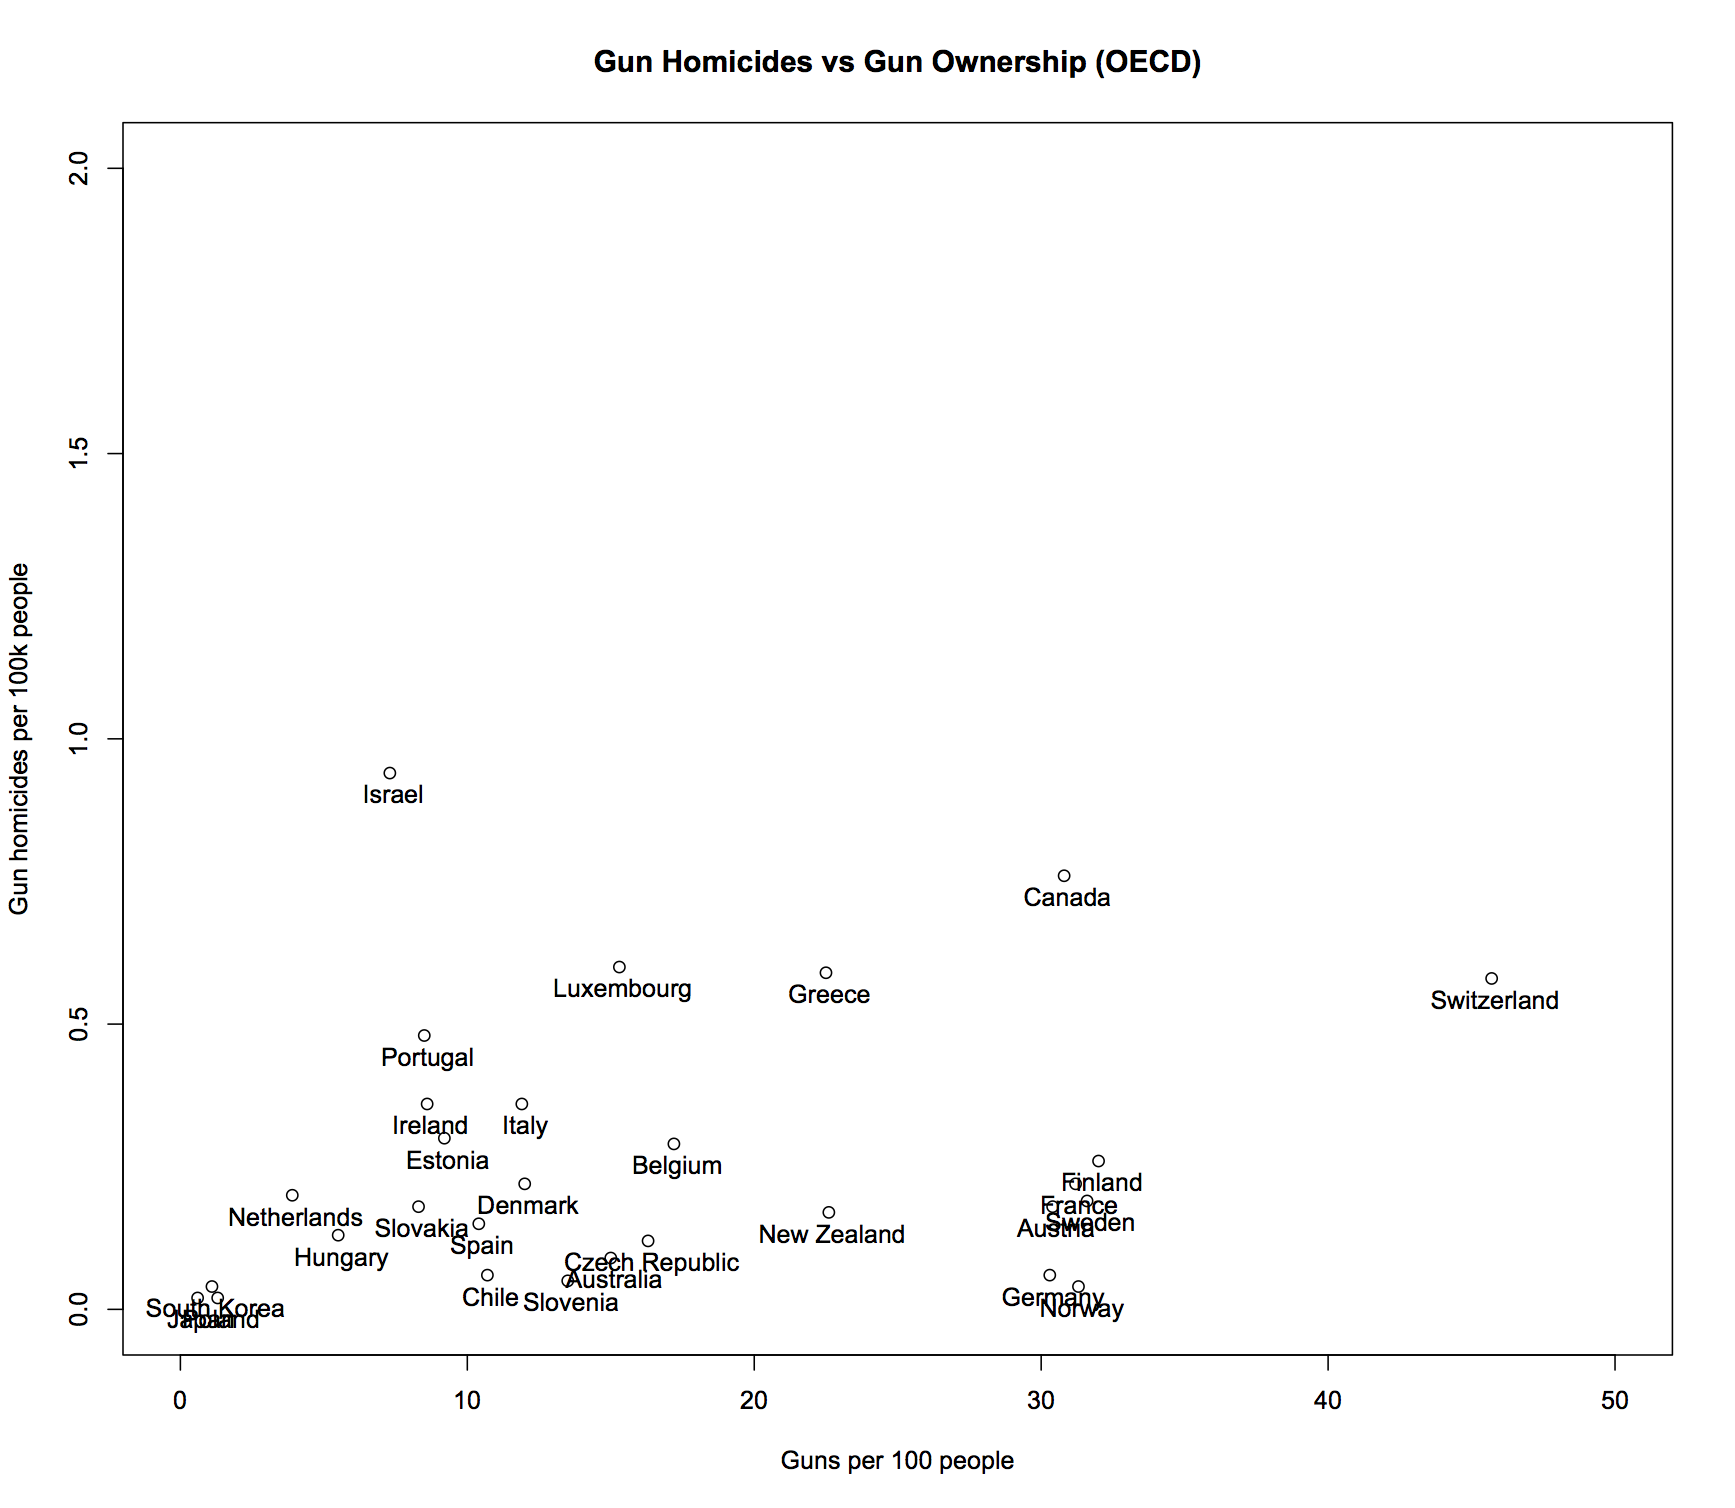
Figure 3: Detail of gun homicides per capita vs. gun ownership per capita in OECD countries.
Finally, here is a plot of homicide vs. ownership across all countries — not just those in the OECD. The mass of countries in the lower left corner is unreadble but you can see those countries with either high homicide rates or high gun ownership clearly.
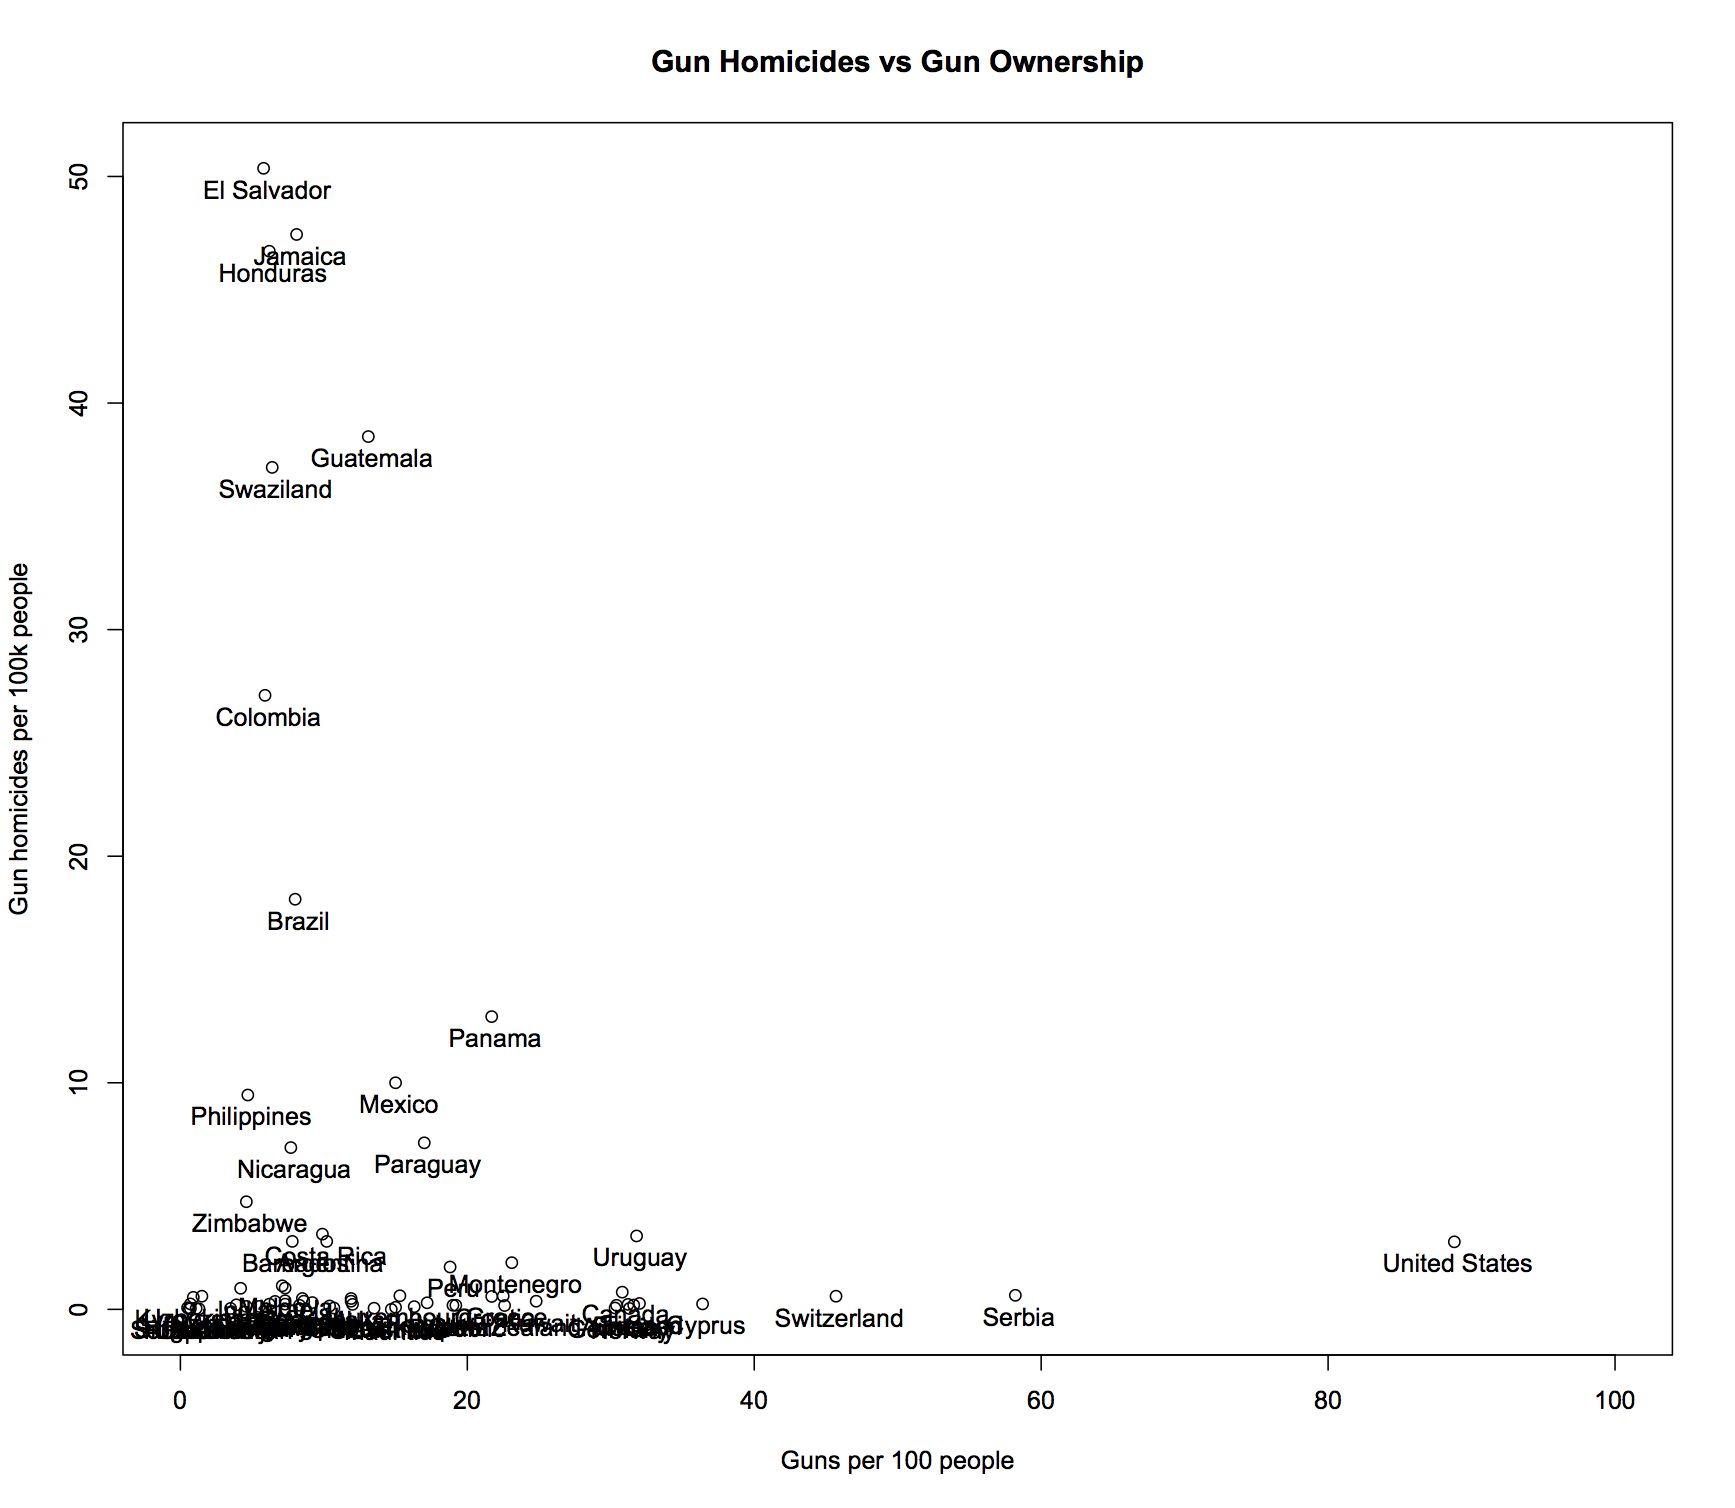
Figure 4: Gun homicides per capita vs. gun ownership per capita in all countries.
Just to be clear, I am not making any claims about the effect of gun ownership on shootings. I just wanted to show how easy it is to use freely available data to help answer reasonable questions about heated political issues like gun control.
I’ll leave you to draw your own conclusions.
Update (19th Dec. 2012)
The response and attention to these plots — both positive and negative — on Twitter, in the comments below, and via email has been a little overwhelming. So much so that my site went down yesterday due to me hitting the (usually sufficient) bandwidth cap my host provides.
Data Updates
Several people noted that the data I plotted for Switzerland was inconsistent with what was on Wikipedia. If you look at the edit history for the firearm-related death rate page on Wikipedia you will see that someone updated the Switzerland data late on the 16th of December. Taking into account that Canberra, Australia is GMT+11 this update occurred after I scraped the page for the data I used here.
I have redone the OECD plots with data scraped from the same pages as of 3:30pm on the 19th. You can see the results and get the new data below.
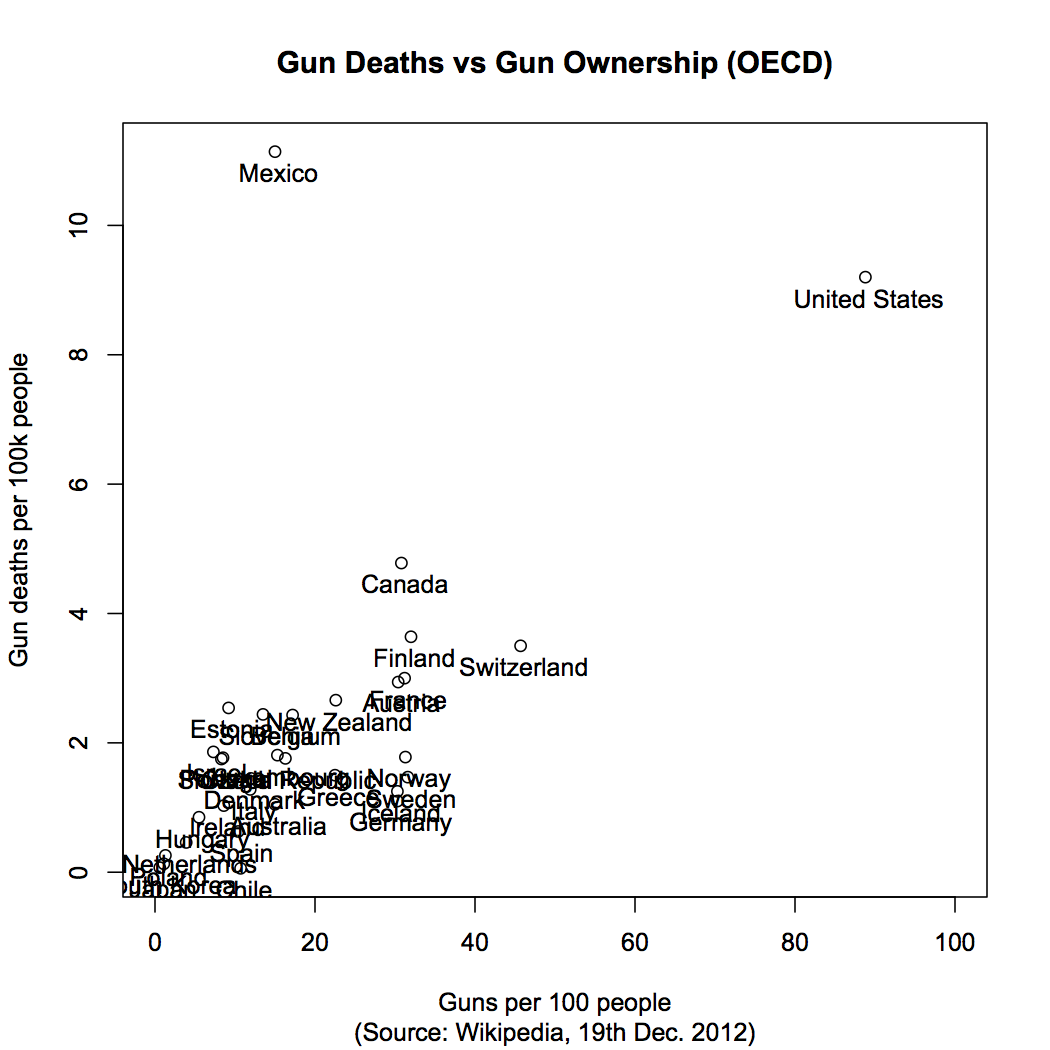
Figure 1 (updated): Gun-related Deaths vs. Gun Ownership for OECD countries.
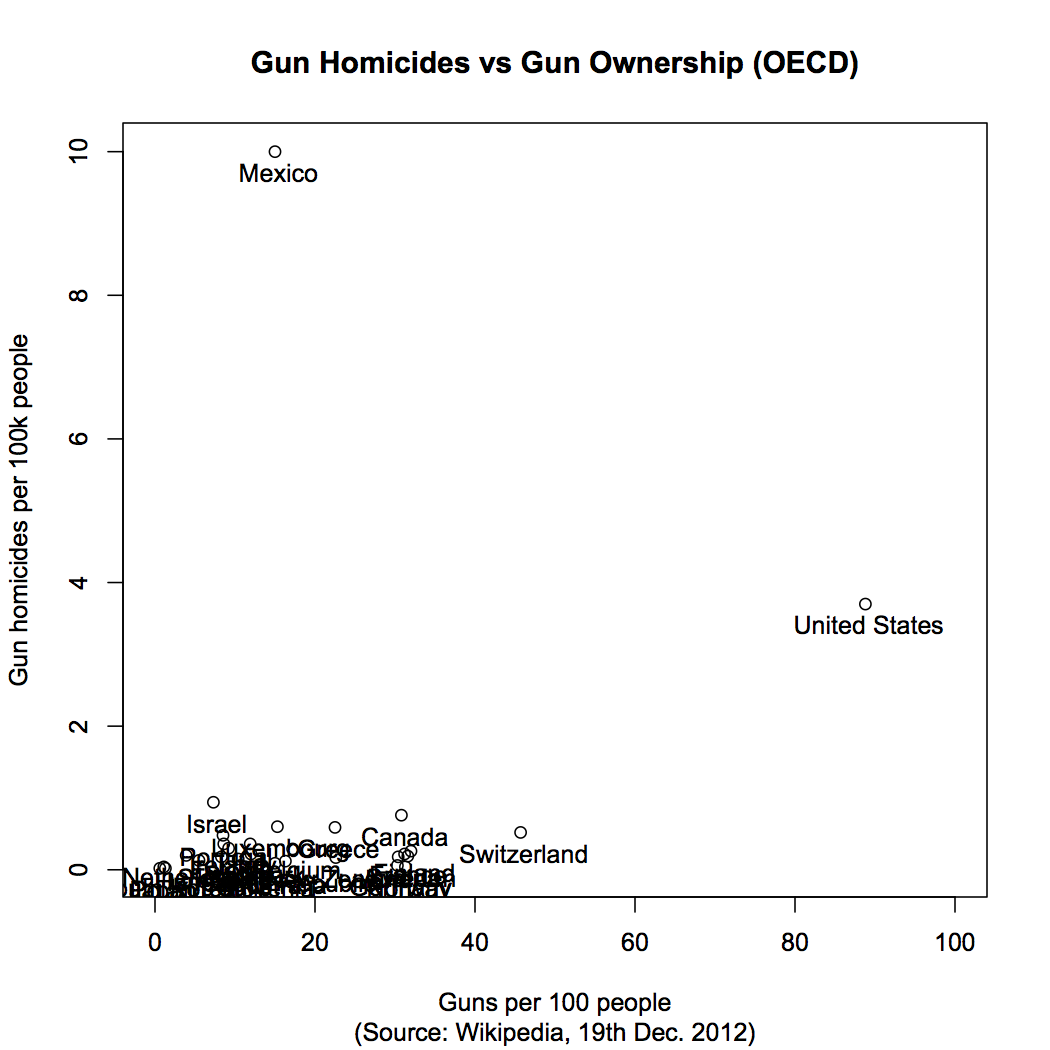
Figure 2 (updated): Gun Homicides vs. Gun Ownership for OECD countries.
The new data is here:
Other Analyses
A number of people pointed me to analyses they had done of similar data, criticisms of this post, and alternative sources of data. Here is a summary of some of those other contributions:
Diego Basch redid some of the above plots with overall homicide data (not just gun homicide).
aphyr redid one of my plots on a log scale and also compared gun homicide to income and wealth.
Dominikus Baur created a more interactive version of the above plots using d3.
Ryan Rosario pointed me towards another analysis of deaths vs. ownership.
finem respice has a very detailed response to this post (and other reporting) that explains why the data I used for Switzerland in my initial graphs was incorrect.
Walter Hickey at Business Insider summarised my post. There is a vigorous discussion in the comments there.
Lev Reyzin tweeted some plots of homicides vs. percentage of gun ownership, included one broken down by US states.
Tim Raupach pointed me towards Nate Silver’s analysis of US gun ownership statistics.
Disclaimer
Finally, in light of some of the more vocal criticism I’ve received, I feel I should reiterate a few points:
At no point have I ever claimed that this is even close to a rigorous analysis. In my original tweet and here I have made it clear that I have used data from Wikipedia. Since I thought it was common knowledge that Wikipedia should never be used as a primary source for any kind of real research, I didn’t expect people to confuse this post with a serious study.
I have not attempted to use these plots to draw any kind of conclusion about the relationship between gun ownership and gun deaths. Indeed, I do not think there exists a simple explanation. All I intended to do was attempt to shed some light on a question I was asked about a possible correlation.
I will not run any kind of statistical test on the above data (e.g., rank correlation coefficients). For any such quantity to be meaningful I would need to assume that the data I collected was much more carefully controlled for. Since I just grabbed it from Wikipedia, this is clearly not a valid assumption.
I do not intend to create more graphs showing other data or other statistics. Other people (see the links above) have already done so for a variety of alternative data. Also, I realise their are better sources of data out there than Wikipedia. However, as I’ve said before, my intention was not to do a definitive study but rather show how a readily accessible source (i.e., Wikipedia) can be used to quickly get an overview of a topic.
I will probably not the last person to use Wikipedia for this sort of amateur analysis. Therefore, if you believe the data I have used is incorrect or out of date, I suggest you solve the problem at the source and update (with references) the relevant entries on Wikipedia.
If you have a question about other possible correlations or relationships, feel free to apply the code above to what ever sources of data you think might help answer it. I’d appreciate it if you link to what you find in the comments below.
Mark Reid December 17, 2012 Canberra, Australia