Visualising ROC and Cost Curve Duality
I’ve been looking into the relationships between losses, divergences and other measures of predictors and problems recently and came across a 2006 paper by Drummond and Holte entitled Cost Curves: An improved method for visualizing classifier performance. This paper describes a representation of classifier performance that is very closely related to the usual ROC curve. However, unlike ROC plots of (False Positive Rate, True Positive Rate)-points for various operating conditions of the classifier cost curves show (cost, risk)-points. That is, for each cost plotted on the x axis, the y co-ordinate shows the cost-weighted loss for the classifier.
As explained in Drummond and Holte’s paper, there is a simple point-line duality between ROC space and Cost-Loss space based on the definition of cost-weighted loss. If \((FP,TP)\) is a point in ROC space then the cost-loss relationship \((c, L)\) is linear and satisfies \[ L = (1-\pi) c FP + \pi (1-c) (1 - TP) \] where \(c\) is the cost of a false positive and \(\pi\) the prior probability of the positive class1.
Given a specific \(\pi\) this relationship is completely invertible. A point \((c,L)\) in cost-loss space corresponds to the following line in ROC space \[ TP = \frac{(1-\pi) c}{\pi(1-c)} FP + \frac{(1-\pi) c - L}{\pi(1-c)}. \]
My ability to intuitively grasp this duality relationship was not that great so I hacked together the following applet to help. On the right is a black curve in ROC space representing five (False Positive, True Positive) rates for some imaginary classifier. The points are (0,0), (0.1, 0.5), (0.3, 0.8), (0.7, 0.95) and (1,1). The diagonal grey line on the ROC plot represents the performance of random classifiers - each increase in True Positive rate is countered by an equivalent decrease in False Positive rate.
The left plot, entitled “Cost Space” shows the (cost,loss) duals of both the black and grey curves from the right-hand plot. The grey diagonal on the right corresponds to a “tent” on the left that represents the best performance of a classifier that constantly predicts a single class.
-
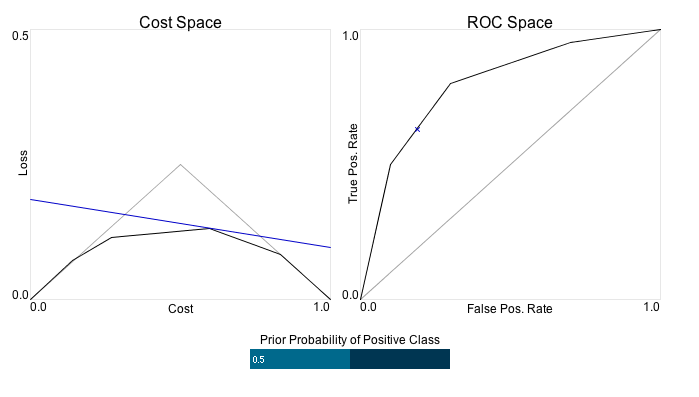
- Figure 1: Screenshot of the cost/ROC visualisation applet. Click here to open the applet and interact with it.
If you click in the applet area you can get a feel for the relationship between these two representations. When you move your mouse over ROC space you will see the corresponding line in cost space. Conversely, when you move your mouse over the cost space plot you will see the dual line in ROC space.
The bar at the bottom of the two plots controls the prior probability \(\pi\). You can see how the dual curve in cost space changes as this parameter is modified.
The code for this applet is available through GitHub. The visualisation aspects are written in Processing and are available here. This relies on some Java code I also wrote that does the point-line conversions.
Chris Drummond has also created an applet to do the same kind of conversion. The one here can be seen as complementary since his version allows the user to add data points and construct curves whereas mine just aims to make the key relationship interactive.
Updates
30 January 2009: Replaced inline applet with a screenshot and link to page hosted on GitHub.
28 July 2009: Link to applet is now hosted locally, not on GitHub.
My description here differs slightly from Drummond and Holte’s in that I am keeping priors and costs separate and not normalising the loss.↩